Anomaly detection in Python: operational triage review queues
Use a fixed review budget to surface unusual operating states without synthetic imputation. The goal is a prioritized list of suspicious records an analyst can inspect within operational constraints.
flowchart LR
    A["Raw Telemetry Stream\n(Sensors, Intermittent Dropouts)"] --> B["AnomalyTree(kind='eif')\n(Oblique Random Cuts)"]
    B --> C["Continuous Anomaly Scores\ns(x) in [0, 1]"]
    C --> D{"Operational Review Budget\n(e.g., Top 5% of Volume)"}
    D -- "Above Threshold" --> E["High-Priority Review Queue\n(Analyst Inspection)"]
    D -- "Below Threshold" --> F["Automated Clearance\n(Normal Operations)"]

    classDef dataBox fill:#1e293b,stroke:#475569,stroke-width:2px,color:#ffffff;
    classDef engineBox fill:#4338ca,stroke:#6366f1,stroke-width:2px,color:#ffffff;
    classDef scoreBox fill:#0369a1,stroke:#0284c7,stroke-width:2px,color:#ffffff;
    classDef gateBox fill:#b45309,stroke:#d97706,stroke-width:2px,color:#ffffff;
    classDef alertBox fill:#881337,stroke:#9f1239,stroke-width:2px,color:#ffffff;
    classDef passBox fill:#065f46,stroke:#059669,stroke-width:2px,color:#ffffff;

    class A dataBox;
    class B engineBox;
    class C scoreBox;
    class D gateBox;
    class E alertBox;
    class F passBox;
1. Domain Context & The Ghost Anomaly Problem
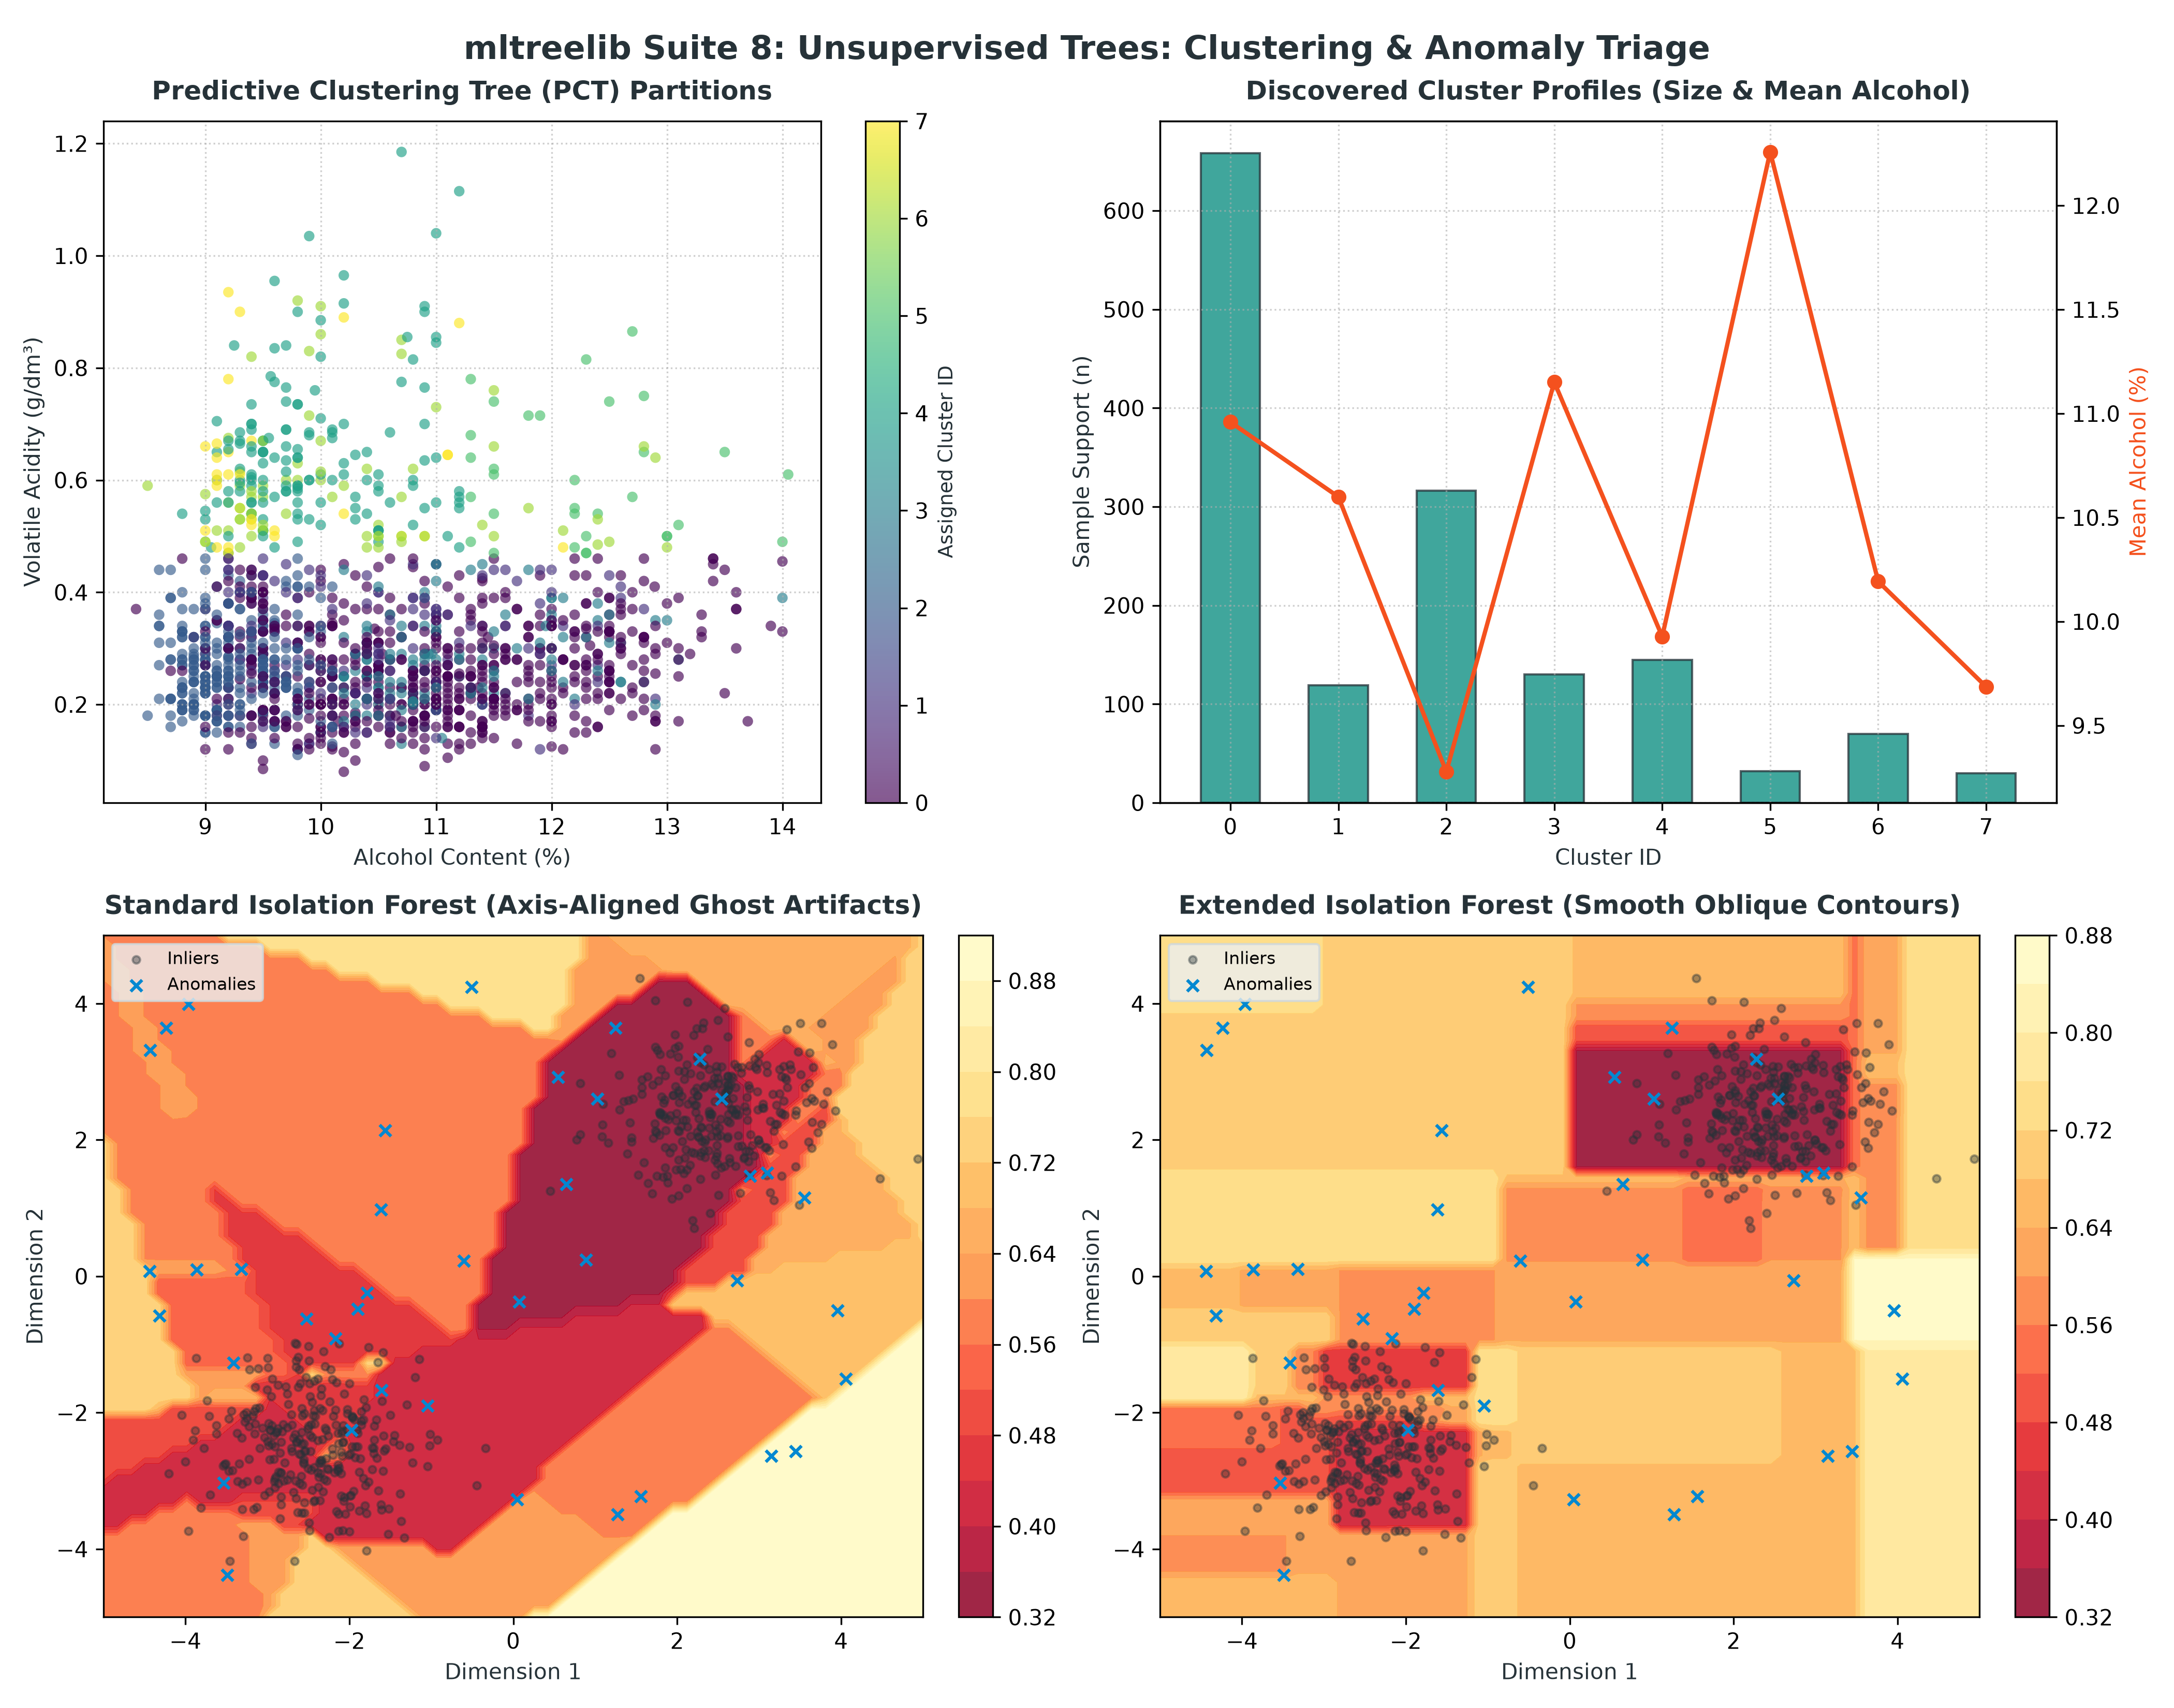
Standard Isolation Forests construct trees by sampling orthogonal, axis-aligned cuts. On correlated or multi-modal feature distributions, axis-aligned splits produce artificial rectangular bands of low average path length, creating false-positive "ghost" anomalies in empty spaces between normal clusters.
AnomalyTree(kind="eif") implements Extended Isolation Forest (EIF), sampling random oblique hyperplanes with uniformly distributed normal vectors. This achieves rotationally invariant scoring contours that isolate true anomalies without axis-aligned artifacts.
2. Fit the Reference Model and Score New Rows
You can evaluate on industrial telemetry using load_dataset("APSFailure") or the UCI Statlog Shuttle benchmark:
from mltreelib import AnomalyTree, Metrics, load_dataset

# 1. Load industrial sensor telemetry
data = load_dataset("APSFailure")
target = "AirPressureSystemFailure"
features = ["aa_000", "ab_000", "ac_000", "ad_000", "ae_000", "af_000"]
n_sample = 10000

y_raw = data["columns"][target][:n_sample]
y = [1 if v in ("pos", "1", 1) else 0 for v in y_raw]
X = [[data["columns"][c][i] for c in features] for i in range(n_sample)]

split = 7000
X_train = [X[i] for i in range(split) if y[i] == 0]  # Fit reference on normal operating states
X_test, y_test = X[split:], y[split:]

# 2. Fit Extended Isolation Forest (oblique cuts, depth=10)
tree = AnomalyTree(kind="eif", max_depth=10, extension_level=1, seed=42)
tree.fit(X_train, col_names=features)

# 3. Score held-out telemetry
scores = tree.score_samples(X_test)

# 4. Allocate fixed 5% operational review budget
budget = round(0.05 * len(scores))
order = sorted(range(len(scores)), key=lambda i: (-scores[i], i))

hits = sum(y_test[i] for i in order[:budget])
total_anomalies = sum(y_test)
print(f"Review Budget Size : {budget} records (Top 5%)")
print(f"Precision at Budget: {hits / budget:.4f}")
print(f"Recall at Budget   : {hits / max(1, total_anomalies):.4f}")

metrics = Metrics()
print(f"ROC-AUC            : {metrics.roc_curve(y_test, scores)['auc']:.4f}")
3. Understand the Anomaly Engine Family
AnomalyTree provides a unified interface across multiple tree-based anomaly engines:
Engine (kind) |
Core Mechanism | Best Used For |
|---|---|---|
"eif" |
Oblique random hyperplanes with uniform normals | Multi-modal, correlated continuous telemetry without ghost artifacts |
"isolation" |
Standard axis-aligned recursive bisection | Fast baseline on uncorrelated low-dimensional features |
"det" |
Density Estimation Trees (piecewise constant density) | Estimating exact probability density distributions |
"hst" |
Streaming Half-Space Trees with mass-based scoring | Online, real-time sliding window data streams |
"rct" |
Robust Random Cut Trees (co-displacement scoring) | Dynamic time-series streams with concept drift |
"active" |
Active learning tree with expert feedback loops | Human-in-the-loop analyst triage queues |
Next Steps
- For unsupervised clustering with rule extraction, study Suite 8: Unsupervised Trees.
- For missing sensor routing under telemetry dropouts, review Suite 3: Native Missing Data.
- See the full Anomaly API Reference.