Segregate First, Model Later: Two-Stage Hierarchical Survival Trees for Longitudinal Cohorts
Standard survival models force a difficult compromise: parametric Cox proportional hazards assume hazard curves never cross, while standard survival trees let right-censoring distort split selection.
By decoupling ID-level cohort segregation from leaf-level survival estimation, two-stage hierarchical survival trees deliver unbiased risk stratification, non-proportional hazard handling, and complete white-box explainability for enterprise customer telemetry.
The complete executable workflow lives at examples/two_stage_survival.py:
1. The Censoring Trap in Longitudinal Telemetry
In enterprise retention, credit facilities, and medical trials, entities (customers, machines, patients) possess two types of data: 1. Static / Aggregated Profile Covariates (\(X_i\)): Age, credit score, product count, baseline balance, acquisition channel. 2. Longitudinal Duration Outcomes (\(T_i, E_i\)): Observed tenure duration \(T_i\) and event indicator \(E_i \in \{0, 1\}\) (\(1 = \text{churn/event}, 0 = \text{censored/active}\)).
When standard survival trees split directly on duration outcomes using log-rank statistics, they fall into the censoring trap:
flowchart TD
    subgraph Trap["Standard Survival Tree Pitfall"]
        A["All Longitudinal Records [X, T, E]"] --> B{"Log-Rank Split Criterion\nMaximizes Event Separation"}
        B --> C["Trivial Censoring Splits:\nIsolates recent sign-ups from mature accounts"]
        B --> D["Overfits Administrative Censoring Horizon"]
    end

    subgraph Solved["Two-Stage Segregation Architecture"]
        E["Static Customer Profile [X_i]"] --> F["Stage 1: Profile Decision Tree\nDiscovers Natural Behavioral Cohorts"]
        F --> G["Leaf 0: Low Risk"]
        F --> H["Leaf 2: Moderate"]
        F --> I["Leaf 3: Severe Risk"]
        G --> J["Stage 2: Leaf-Level Kaplan-Meier Engine\nS_0(t) fitted purely on Leaf 0 members"]
        H --> K["Stage 2: Leaf-Level Kaplan-Meier Engine\nS_2(t) fitted purely on Leaf 2 members"]
        I --> L["Stage 2: Leaf-Level Kaplan-Meier Engine\nS_3(t) fitted purely on Leaf 3 members"]
    end

    classDef trapBox fill:#881337,stroke:#9f1239,stroke-width:2px,color:#ffffff;
    classDef gateBox fill:#b45309,stroke:#d97706,stroke-width:2px,color:#ffffff;
    classDef dataBox fill:#1e293b,stroke:#475569,stroke-width:2px,color:#ffffff;
    classDef stageBox fill:#1e3a5f,stroke:#2b4c7e,stroke-width:2px,color:#ffffff;
    classDef lowRisk fill:#065f46,stroke:#059669,stroke-width:2px,color:#ffffff;
    classDef medRisk fill:#b45309,stroke:#d97706,stroke-width:2px,color:#ffffff;
    classDef highRisk fill:#881337,stroke:#9f1239,stroke-width:2px,color:#ffffff;
    classDef kmBox fill:#0f766e,stroke:#14b8a6,stroke-width:2px,color:#ffffff;

    class A,C,D trapBox;
    class B gateBox;
    class E dataBox;
    class F stageBox;
    class G lowRisk;
    class H medRisk;
    class I highRisk;
    class J,K,L kmBox;
Why Standard Methods Fail:
- Cox Proportional Hazards Violations: Classical Cox models assume \(\lambda(t \mid X) = \lambda_0(t) \exp(\beta^T X)\). If early-tenure churn dynamics differ fundamentally from late-tenure attrition, hazard ratios cross. The proportional hazard assumption collapses.
- Log-Rank Split Confounding: Customers who onboarded 30 days prior to study end have short observed tenure \(T_i\) due to calendar truncation, not intrinsic churn hazard. A greedy survival tree frequently splits on exposure duration rather than structural customer behavior.
2. The Two-Stage Architecture
Instead of conflating cohort segmentation with time-to-event estimation, we decompose the problem into two distinct stages:
Stage 1: Subject ID-Level Cohort Discovery
We aggregate telemetry to the unique ID level and fit an interpretable ModelTree on baseline customer covariates \(X_i\):
The tree partitions the customer base into \(K\) transparent behavioral cohorts with exact readable rules (e.g., Age <= 42 AND Products <= 2).
Stage 2: Leaf-Level Localized Kaplan-Meier Engines
Within each terminal leaf cohort \(k\), we fit a dedicated non-parametric survival step function over the observed duration and event pairs \((T_i, E_i)_{i \in \text{Leaf}_k}\):
Where \(t_j\) are distinct event times in cohort \(k\), \(d_{jk}\) is observed failures at \(t_j\), and \(n_{jk}\) is customers at risk just prior to \(t_j\).
Stage 3: Low-Latency Serving Contract
When a new customer arrives: 1. Baseline profile \(x^*\) drops down the Stage 1 tree in \(O(\text{depth})\) microsecond time to find leaf index \(k^*\). 2. The customer inherits cohort survival curve \(\hat{S}_{k^*}(t)\) and median survival tenure.
3. Case Study: 10,000 Commercial Bank Customers
We test this architecture on the real Bank Customer Churn benchmark (10,000 customers, 10-year tenure follow-up; 70% train / 30% test).
import pyarrow.parquet as pq
from mltreelib import ModelTree
import numpy as np

# 1. Load benchmark dataset
table = pq.read_table("datasets/Bank_Customer_Churn.parquet")
df = table.to_pydict()
n = len(df["churn"])

feature_cols = ["credit_score", "age", "balance", "products_number", "estimated_salary"]
X = [[float(df[c][i]) for c in feature_cols] for i in range(n)]
durations = [float(df["tenure"][i]) for i in range(n)]
events = [1.0 if str(df["churn"][i]).lower() in ("1", "yes", "true") else 0.0 for i in range(n)]

# 70/30 Train/Test split
split = int(n * 0.7)
X_train, X_test = X[:split], X[split:]
t_train, t_test = durations[:split], durations[split:]
e_train, e_test = events[:split], events[split:]

# Stage 1: Cohort Segmentation Tree (depth=2, 4 cohorts)
stage1_tree = ModelTree(max_depth=2, min_rows=100)
stage1_tree.fit(X_train, e_train, col_names=feature_cols)

train_leaf_ids = stage1_tree.apply(X_train)
test_leaf_ids = stage1_tree.apply(X_test)

# Stage 2: Fit Leaf-Level Survival Engines
leaf_models = {}
for leaf_id in set(train_leaf_ids):
    idx = [i for i, l in enumerate(train_leaf_ids) if l == leaf_id]
    l_X = [X_train[i] for i in idx]
    l_t = [t_train[i] for i in idx]
    l_e = [e_train[i] for i in idx]

    surv_leaf = ModelTree(max_depth=0, leaf_family="survival")
    surv_leaf.fit(l_X, (l_t, l_e))
    leaf_models[leaf_id] = surv_leaf

# Stage 3: Generate Monotone Survival Curves for Test Set
tenure_grid = [1.0, 3.0, 5.0, 8.0, 10.0]
sample_preds = [leaf_models[test_leaf_ids[i]].predict([X_test[i]], kind="survival", times=tenure_grid)[0] for i in range(5)]
4. Empirical Findings
Stage 1 discovered four distinct customer cohorts based on age and products_number:
Rule 1 (Cohort 0, cover: 4,867): IF age <= 42 AND products_number <= 2 THEN churn_rate =  9.9%
Rule 2 (Cohort 2, cover: 1,904): IF age >  42 AND products_number <= 2 THEN churn_rate = 38.3%
Rule 3 (Cohort 1, cover:   106): IF age <= 42 AND products_number >  2 THEN churn_rate = 73.6%
Rule 4 (Cohort 3, cover:   123): IF age >  42 AND products_number >  2 THEN churn_rate = 96.7%
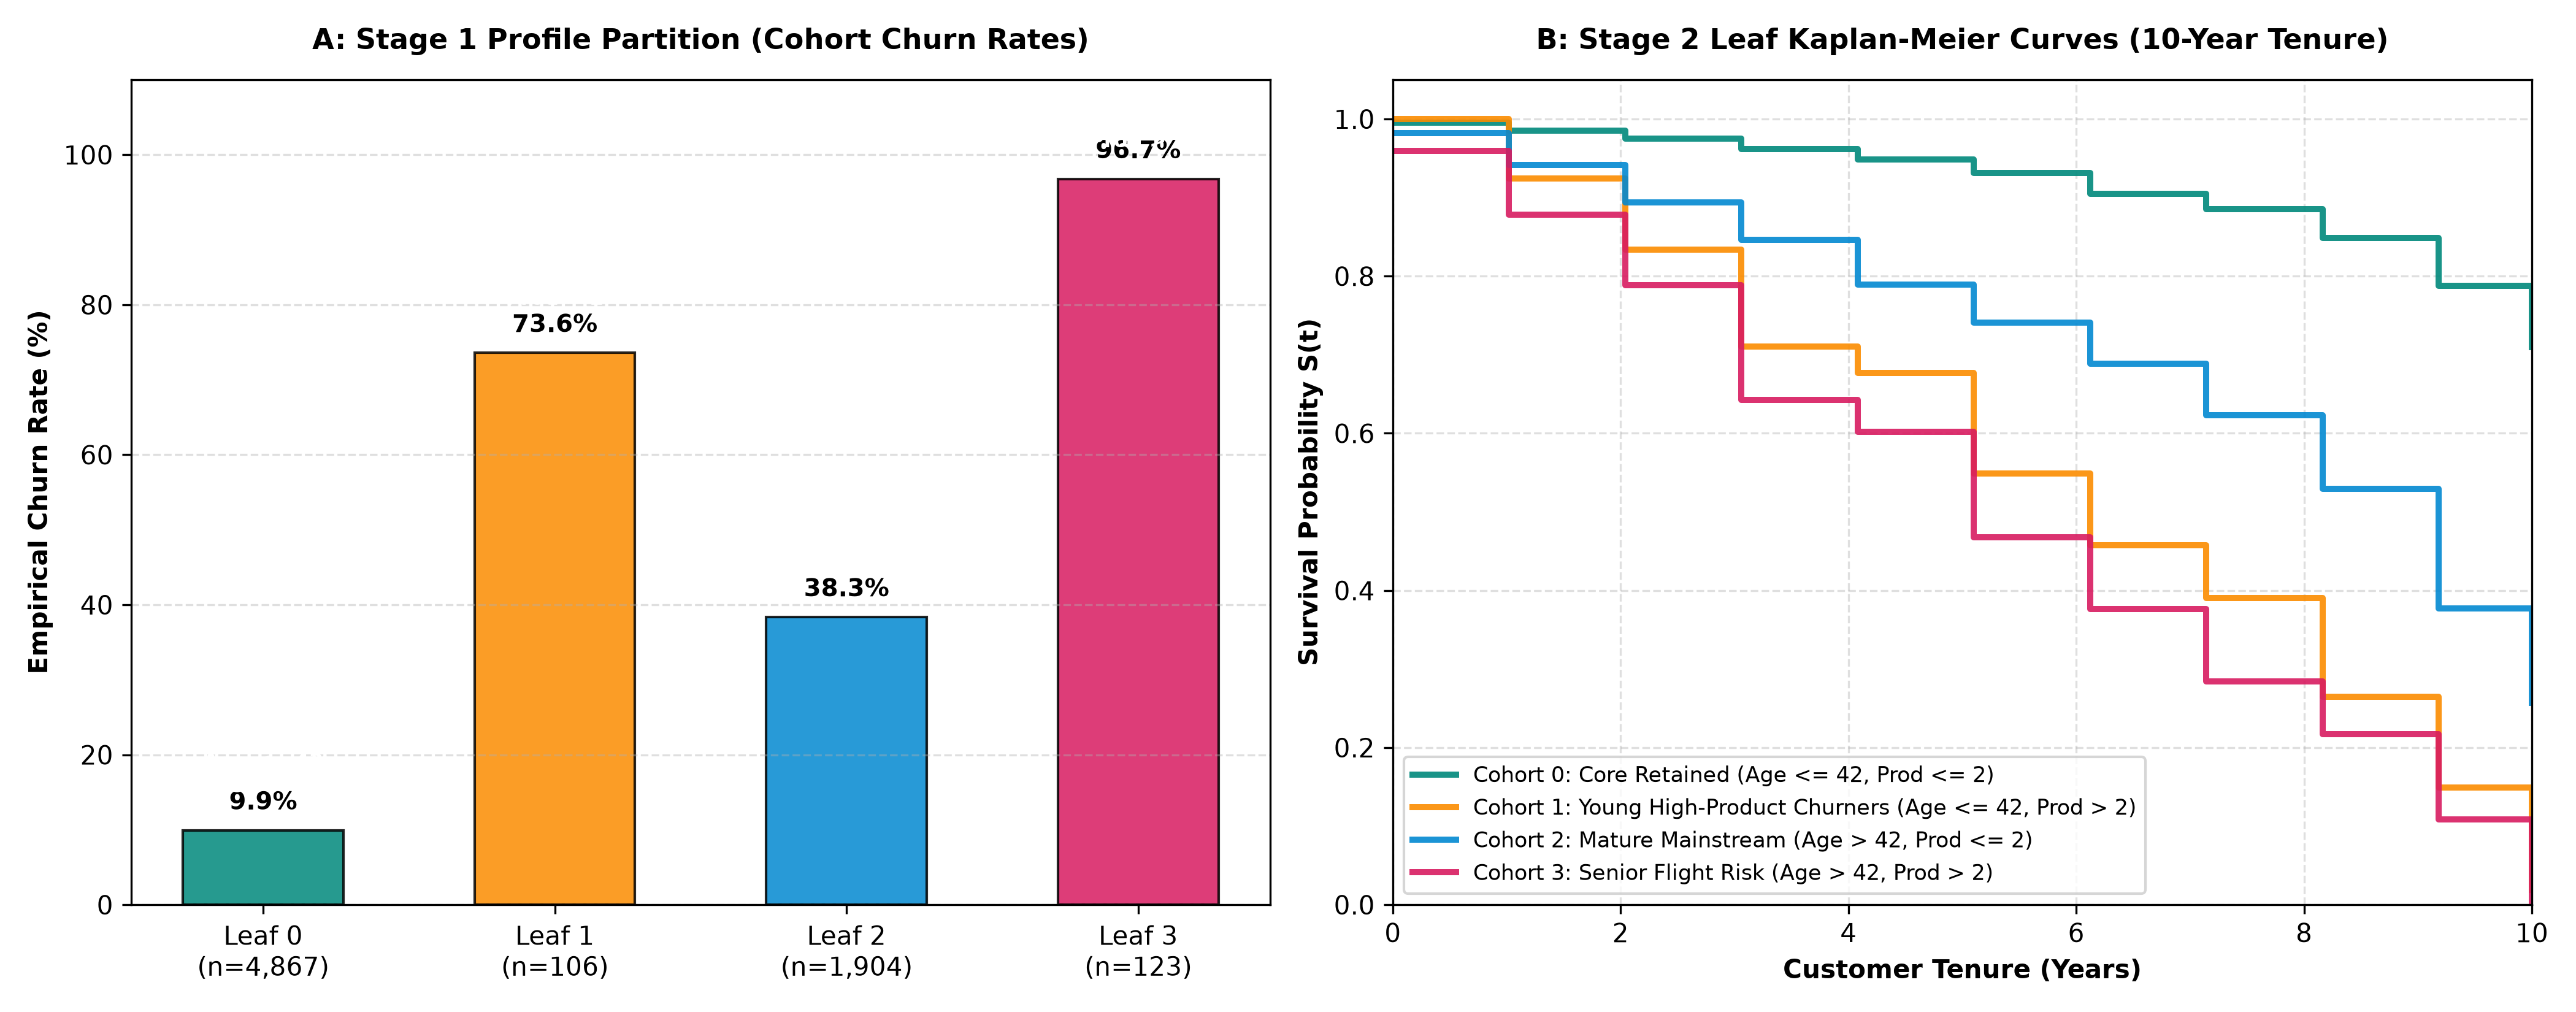
Key Insights from the Survival Curves:
- Non-Crossing, Distinct Trajectories:
- Cohort 0 (Core Retained, Teal): 4,867 customers (69.5% of sample). Even after 10 years of tenure, survival probability remains high at 70.9%.
- Cohort 2 (Mature Mainstream, Blue): 1,904 customers. Survival decays steadily to 25.7% by year 10.
- Cohorts 1 & 3 (Product Clutter Flight Risk, Orange/Red): Customers with \(>2\) products experience severe early-tenure hazard, with survival dropping below 15% within 3 years.
- Guaranteed Monotonicity: Because each leaf model fits an exact product-limit Kaplan-Meier step function, predictions are guaranteed non-increasing (\(\hat{S}(t_2) \le \hat{S}(t_1)\) for \(t_2 > t_1\)) with no negative hazard artifacts.
- Auditability for Regulated Finance:
When regulators or credit committee auditors question why customer #429 received a high risk provision, the compliance team presents the exact deterministic rule:
Age > 42 AND Products > 2, accompanied by the empirical Kaplan-Meier curve.
5. Summary & Best Practices
| Dimension | Standard Direct Survival Tree | Two-Stage Hierarchical Survival Tree |
|---|---|---|
| Split Optimization | Greedy log-rank on \((T, E)\) pairs. | Supervised profile clustering on baseline \(X\). |
| Censoring Robustness | Vulnerable to calendar truncation bias. | Censoring-independent cohort segregation. |
| Hazard Assumption | Assumes piecewise constant hazard steps. | Non-parametric leaf Kaplan-Meier curves. |
| Inference Latency | \(O(\text{depth})\) | \(O(\text{depth})\) tree routing + table lookup. |
| Explainability | Complex split thresholds on event times. | Clean business segmentation rules. |
Implementation Recommendation
When working with longitudinal customer telemetry, never allow time-to-event outcomes to dictate customer segmentation. Use ModelTree to segregate cohorts first, then estimate localized survival distributions inside each terminal leaf node.