Uplift modeling with causal trees: does targeting beat emailing everyone?
A customer can be likely to visit your site without receiving an email. Sending to that customer only helps if the email changes their behavior. A response model estimates the chance of a visit. An uplift model estimates how much that chance changes under the intervention.
This walkthrough fits a causal tree, chooses a targeting threshold and estimates the policy's incremental visits on a randomized test set.
Get a real treatment and control dataset
The Hillstrom experiment assigned 64,000 customers across two email variants and a control group. Compare the women's email with no email. Use the visit indicator for a site visit in the next two weeks. Keep the men's email arm out of this comparison. The outcome and campaign assignment stay out of the feature matrix.
Download the CSV mirror to datasets/external/real_eval/hillstrom.csv. It matches the published record and arm counts. The uplift pathway records the file checksum and source details. Clone the repo and run uv sync. Run the code below from the repository root.
Fit the causal tree and set a threshold
Shuffle once. Use 25,615 training rows, 8,539 validation rows and 8,539 test rows. The split assumes independent customer records from the same experiment. Honest estimation separates rows for split selection and leaf estimates inside the training set. Validation chooses the cutoff from the possible scores. The test set is reserved for the chosen policy and two fixed alternatives.
from random import Random

import pandas as pd
from mltreelib import ModelTree
from examples.real_survival_uplift import group_value

df = pd.read_csv("datasets/external/real_eval/hillstrom.csv")
df = df[df.segment.isin(["Womens E-Mail", "No E-Mail"])]
features = ["recency", "history", "mens", "womens", "newbie", "zip_code", "channel"]
types = ["numeric"] * 5 + ["categorical"] * 2
ids = list(range(len(df)))
Random(2026).shuffle(ids)
a, b = int(.6 * len(ids)), int(.8 * len(ids))

def inputs(indices):
    part = df.iloc[indices]
    x = [[None if pd.isna(v) else v for v in row]
         for row in part[features].itertuples(index=False, name=None)]
    return x, part.visit.tolist(), (part.segment == "Womens E-Mail").astype(int).tolist()

x_train, y_train, w_train = inputs(ids[:a])
x_val, y_val, w_val = inputs(ids[a:b])
x_test, y_test, w_test = inputs(ids[b:])
tree = ModelTree(gain="causal", leaf="mean", max_depth=2, min_rows=250,
                 prune="none", honesty=True, seed=42)
tree.fit(x_train, (y_train, w_train), col_names=features, dtypes=types)

val_scores = tree.predict(x_val, kind="uplift")
def value_at(threshold):
    return group_value(y_val, w_val, [score > threshold for score in val_scores])[0]

threshold = max([min(val_scores) - 1, *sorted(set(val_scores))], key=value_at)
test_scores = tree.predict(x_test, kind="uplift")
for selected in ([score > threshold for score in test_scores],
                 [True] * len(y_test), [False] * len(y_test)):
    print(group_value(y_test, w_test, selected))
What does the test set say?
| Policy | Selected customers | Treated / control within selection | Incremental visits per 100 eligible customers |
|---|---|---|---|
| Validation-selected policy | 8,539 | 4,270 / 4,269 | 4.52 |
| Treat all | 8,539 | 4,270 / 4,269 | 4.52 |
| Treat none | 0 | — | 0 |
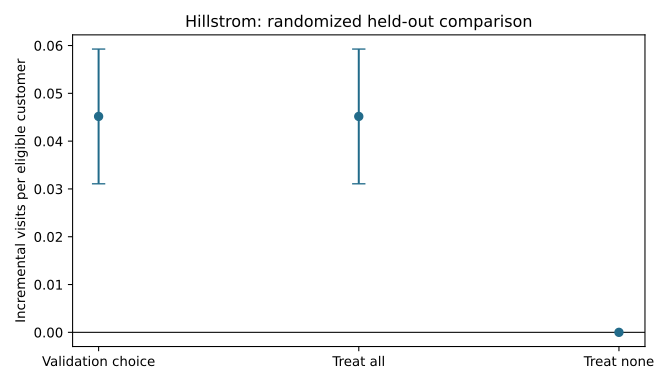
The selected policy sends to everyone. The approximate 95% interval is 3.11 to 5.93 incremental visits per 100 eligible customers. This experiment shows evidence of an average visit lift for the email in this test split. It gives no evidence of an improvement from targeting.
The policy calculation takes the difference in visit rates between randomized arms among selected customers. It then multiplies by the selected share of the test population. The interval holds selection fixed and does not include threshold-selection uncertainty. The example assumes zero email cost because the dataset supplies no campaign cost. Use the decision's actual outcome, such as margin or conversions, before making a budget decision.
What should you inspect before a new trial?
Check that the features reflect information available before sending, and that each candidate segment contains enough treated and control customers. Record the assignment probability. Inspect the tree rules and segment counts, then compare any proposed budget-constrained policy with an equally sized random send. If comparing against treat-all, use uncertainty for the difference between policies on the same test records. Assign a new randomized holdout before deployment.
For the assumptions and mechanics behind honest causal trees, see Athey and Imbens (2016).