Data Processing
The data & feature layer, one script at a time: ingest and missingness, the 18 encoders, grouped/trended/windowed features, the generator's ground truth, and the drop-and-warn NA behavior.
uv run python examples/data_layer_demo.py              # default: churn
uv run python examples/data_layer_demo.py diamonds wine_quality
One script, real data, every detail printed. Below is the full output of the default run, step by step.
Step 1 — real dataset (churn, 5,000 × 20)
Column types and missingness first — n_missing and na_counts are shown by
default, never hidden. Then numeric summaries, category inference
(n_category: integral numerics with few distinct levels become categorical),
IndexMapper levels, and grouped transforms with an inverse roundtrip check.
==============================================================================
1. REAL DATASET: churn
==============================================================================
rows x cols        : 5000 x 20
categorical columns: 5 -> state, area_code, international_plan, voice_mail_plan, CustomerChurned
numeric columns  : 15 -> account_length, number_vmail_messages, total_day_minutes, total_day_calls, total_day_charge, total_eve_minutes, total_eve_calls, total_eve_charge …(+7)
missing (na_counts): none

numeric summaries (count, n_missing, mean, std, min, q1, median, q3, max):
  account_length                 5000     0       100.3      39.69          1         73        100        127        243
  number_vmail_messages          5000     0       7.755      13.55          0          0          0         17         52
  total_day_minutes              5000     0       180.3      53.89          0      143.7      180.1      216.2      351.5
  total_day_calls                5000     0         100      19.83          0         87        100        113        165

DatasetBuilder(n_category=5% of rows): integral numerics promoted to categorical: ['account_length', 'number_customer_service_calls', 'number_vmail_messages', 'total_day_calls', 'total_eve_calls', 'total_intl_calls', 'total_night_calls']
na_counts after ingest: none

IndexMapper[state]: 51 levels; sample: 3->0, 23->1, 36->2, 37->3, 11->4

group mean of account_length by state (first 5): ['103.8', '101.7', '104', '101.3', '101.8']
group zscore of account_length by state (first 5): ['-0.9772', '-1.192', '1.196', '1.335', '-0.06307']
zscore -> inverse roundtrip ok       : True
Step 2 — synthetic generator with ground truth
20,000 rows with known structure: the realized variance share of each component is the answer key for structure-recovery experiments.
==============================================================================
2. SYNTHETIC GENERATOR WITH GROUND TRUTH
==============================================================================
rows: 20000, columns: 8
realized variance share of each component:
  numeric       0.841
  categorical   0.137
  hierarchy     0.364
  interaction   0.031
  noise         0.017
  (total var)   2.400
cat_0 true level effects (first 4): [1.219, 0.186, 0.252, 0.098]
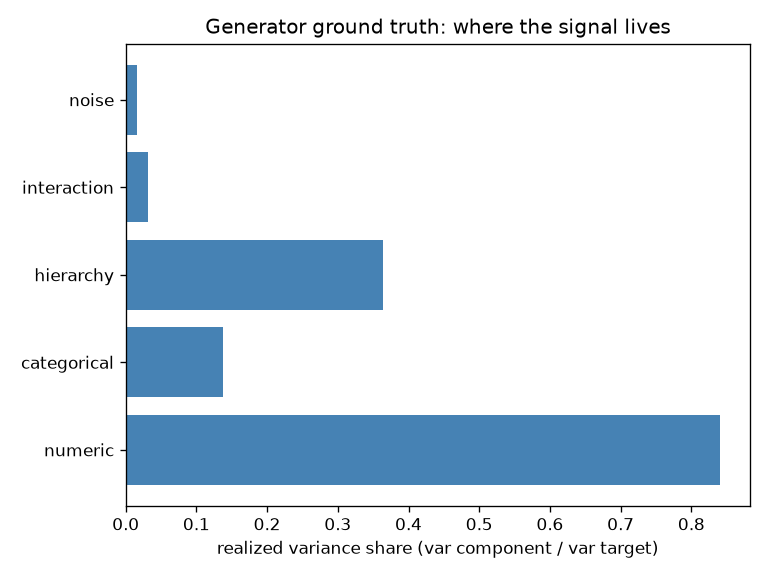
rendered by mltreelib.plots.plot_variance_shares (the same figure the
generator's truth["variance"] feeds).
Step 3 — time features and missing-data behavior
A synthetic two-store panel: calendar parts, day lags, trended and windowed
aggregations, and the additive decomposition — residuals sit at machine zero on
this clean panel. The last block feeds an incomplete row deliberately: it is
dropped from estimation with a UserWarning, and its output is missing.
==============================================================================
3. TIME FEATURES ON A SYNTHETIC PANEL (NA handling included)
==============================================================================
dates           : 2026-01-05 .. 2026-01-25 (2 stores x 21 days)
  weekday       : ['0', '1', '2', '3', '4', '5', '6']
  weekend       : ['0', '0', '0', '0', '0', '1', '1']
  season        : ['3', '3', '3', '3', '3', '3', '3']

lag 7 days (first 8)          : ['-', '-', '-', '-', '-', '-', '-', '12']
year_month mean (first 5)     : ['13', '13', '13', '13', '13']
7-day trailing sum (first 10) : ['12', '24.3', '36.9', '49.8', '63', '69.5', '76.3', '78.4', '80.5', '82.6']

decomposition (store_a, rows 5..12):
    value   detrend  deseason  residual
     6.50        -5      11.5         0
     6.80        -5      11.8         0
     14.10         2      12.1 8.882e-16
     14.40         2      12.4         0
     14.70         2      12.7         0
     15.00         2        13 -4.441e-16
     15.30         2      13.3         0
     8.60        -5      13.6         0

NA handling (drop + warn):
  warning: lag_by_days: 1 rows with missing key/date/value dropped from estimation; outputs left as missing
  output : [None, None, None, None]  (incomplete rows -> missing)
figure: examples/out/variance_shares.png
figure: examples/out/decomposition.png

==============================================================================
DONE — details printed above cover ingest, missingness, encodings, grouped/trended/windowed/decomposed features and ground truth
==============================================================================
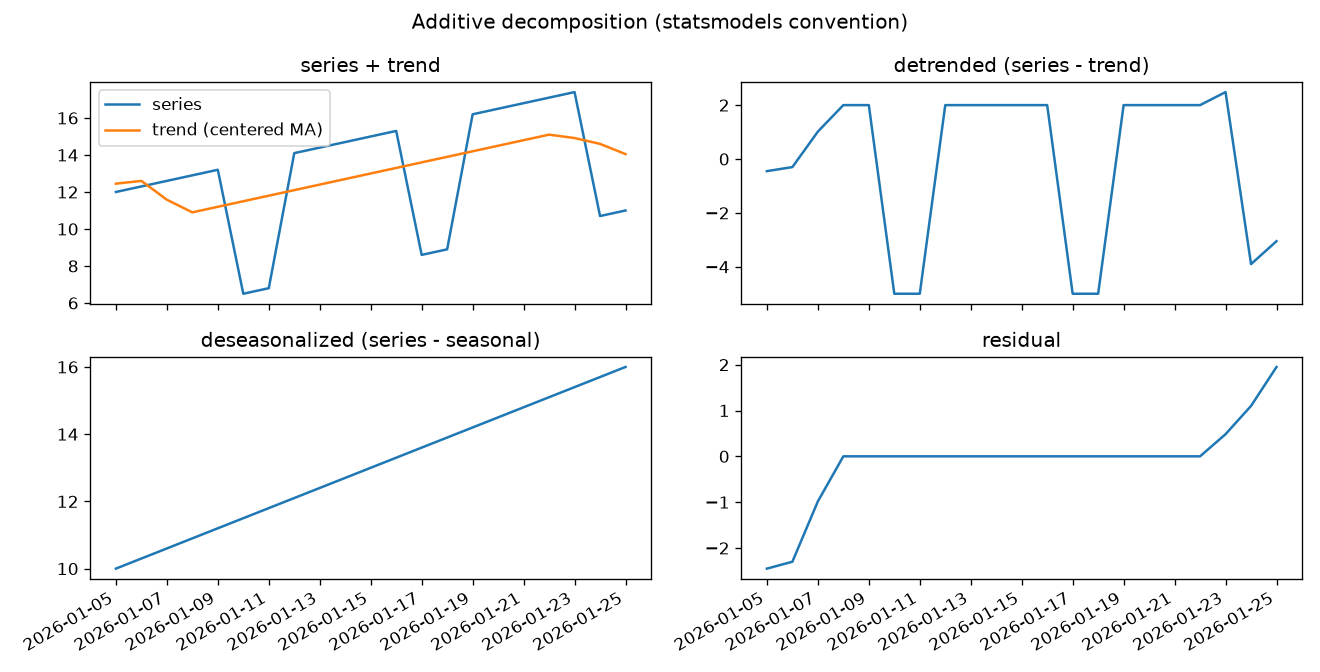
Figures are rendered when matplotlib and seaborn are installed (dev extras;
the library itself does not depend on them).