Metrics & plots
Every evaluation surface and every chart, demonstrated on real data (bank
churn, with the tree's predictions as scores). Script:
examples/metrics_showcase.py.
pip install mltreelib[plotting]        # matplotlib + pygraphviz + seaborn
uv run python examples/metrics_showcase.py
The full surface, in one run
The script fits ModelTree on raw categorical labels and evaluates a held-out slice. It computes its comparison baseline from the training outcomes. The break-down chart uses a separately fitted numeric-only model because break_down rejected raw strings in a tested mixed row. A threshold of 0.5 is illustrative; select operational thresholds on validation data. The evaluation pathway demonstrates that sequence with reproducible synthetic data.
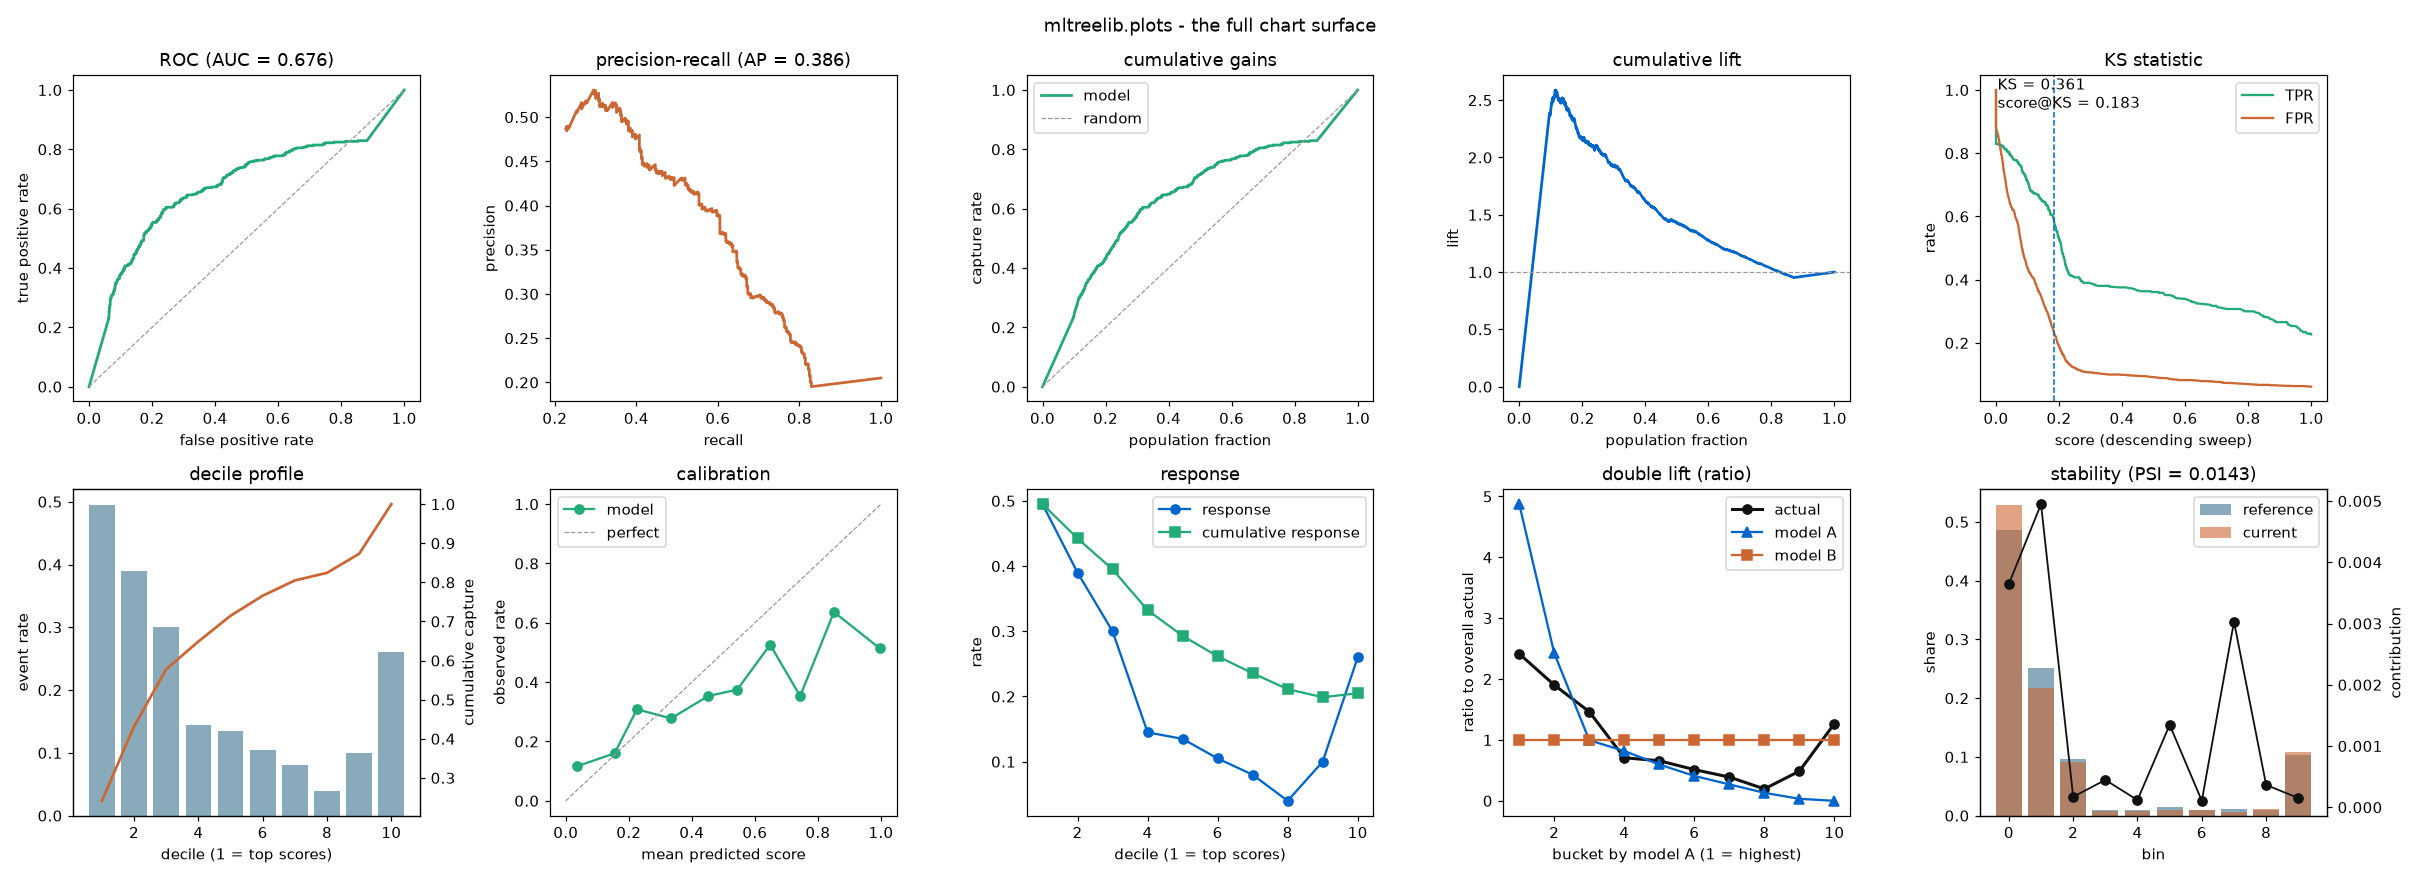
The chart surface
All sixteen charts from mltreelib.plots render as click-to-zoom figures in Visualization Guide:
| chart | what it answers |
|---|---|
plot_roc / plot_pr |
discrimination; PR is the honest view on class imbalance |
plot_cumulative_gain / plot_lift |
targeting efficiency: "top decile captures X% at Y× lift" |
plot_ks |
maximum separation distance between classes + Score@KS |
plot_decile |
scorecard decile profile: event rate bars + cumulative capture |
plot_calibration / plot_response |
probability reliability vs. diagonal and decile response |
plot_double_lift |
head-to-head model comparison along one ranking (CAS) |
plot_psi |
score/feature stability and population shift between two periods |
plot_confusion_matrix |
classification error distribution across class boundaries |
plot_residuals |
regression fit diagnostics: actual vs. predicted and equality line |
plot_importance |
variable importance shares of total split gain |
plot_breakdown |
DALE-style waterfall attribution of one observation |
plot_variance_shares |
realized variance shares against ground truth |
plot_decomposition |
4-panel additive time-series decomposition (trend/season/residual) |
Each chart takes ax= and returns Axes, so any panel composes. The
library itself never imports matplotlib — this layer is opt-in via the
[plotting] extra. Every number on this page comes from the script; the
API shapes are in Metrics.